
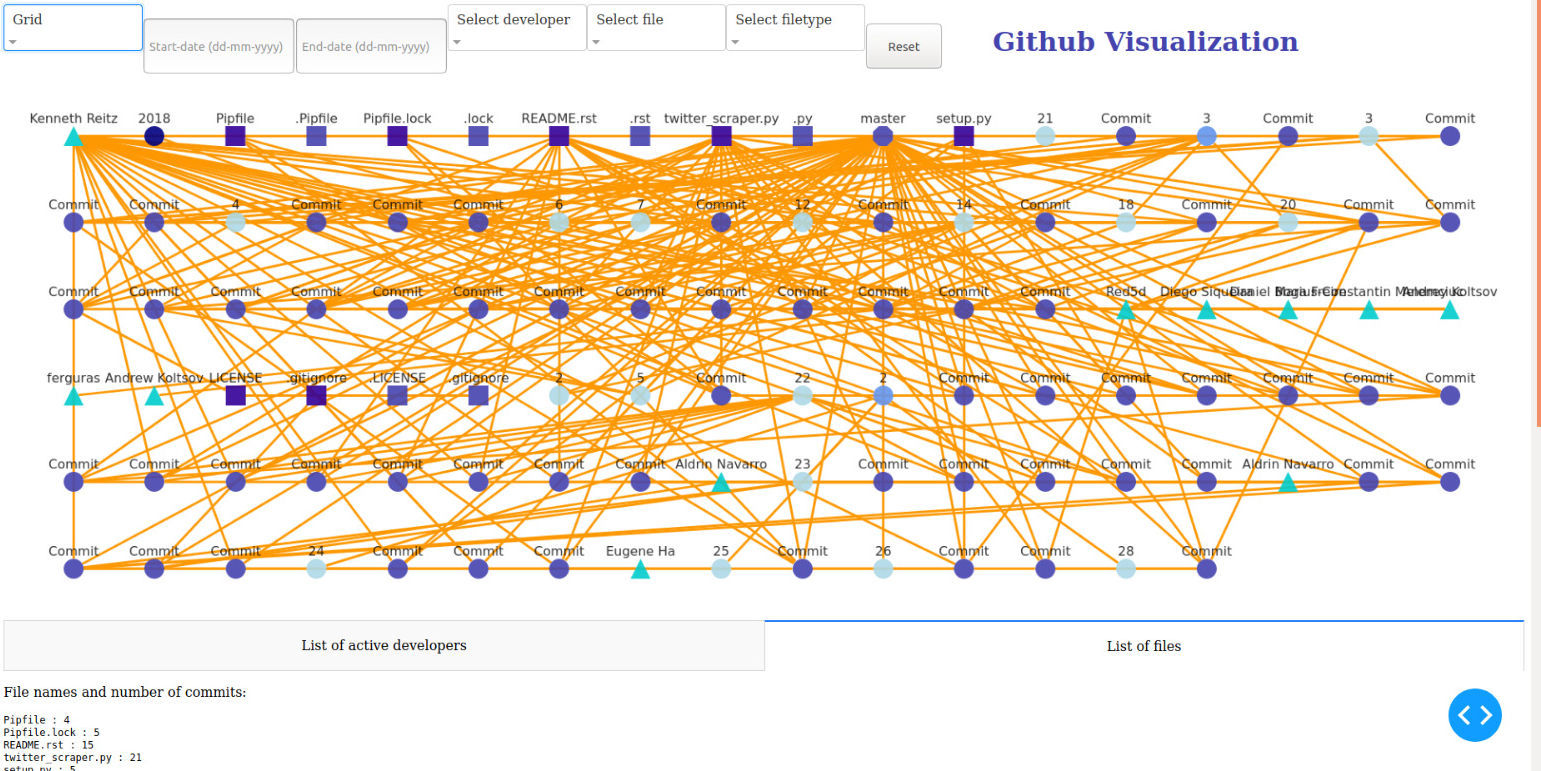
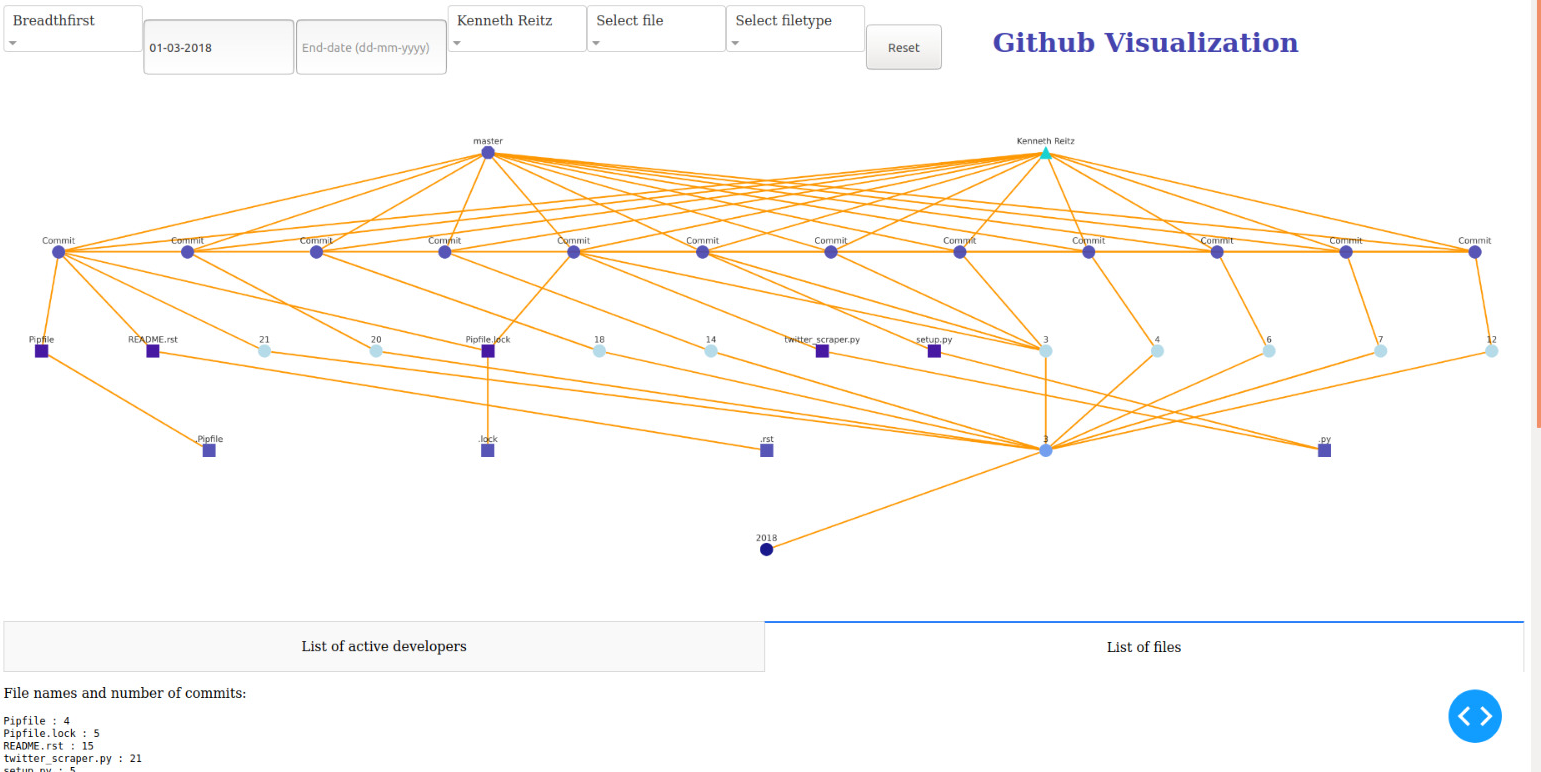
The Github-Visualization tool enables the visualization of Github projects. It displays a graph of the files in a project, which visualizes who did what and when, and which files are connected. The tool lets one configure a range of dates to see what work has been done in that period, and filter the graph by developer, file or filetype.
Our customer was Software Improvement Group (SIG). We had weekly contact with them through Skype and we met up from time to time at the Snellius building. We went to their headquarters to get the requirements for the project and to present our final product. We enjoyed working with them, and learned a lot about software engineering from SIG.

Our team consisted of five students. Three of them study Computer Science and the other two Computer Science and Economics. The latter two students also took the position of project manager upon them and the former did most of the programming work.
The programming language that we used throughout the project was Python. We also used the frameworks Dash, Docker, and a framework given to us by SIG. The latter already gave us a way to get the data from a certain GitHub repository.